Quick Summary: Tennessee gained 416 yards to Detroit’s 225 at Ford Field on October 27, 2024, but lost 52-14. Four turnovers killed Tennessee. Kalif Raymond torched his former team for 190 punt return yards (fifth-most in NFL history). Detroit scored on all five red zone trips. Tennessee failed on four straight plays from the 1-yard line. The Lions became just the third team since 1941 to have a 90+ yard punt return and 70+ yard kickoff return in the same game.
Key Takeaways
- The Paradox: Tennessee outgained Detroit 416-225 but lost by 38 points
- Turnovers: 4-0 advantage for Detroit led to 21 points
- Special Teams: 262 return yards allowed by Tennessee
- Red Zone: Detroit 5-for-5, Tennessee 2-for-4
- Historic Performance: Kalif Raymond’s 190 punt return yards ranks 5th all-time
Table of Contents
When 416 Yards Gets You Blown Out
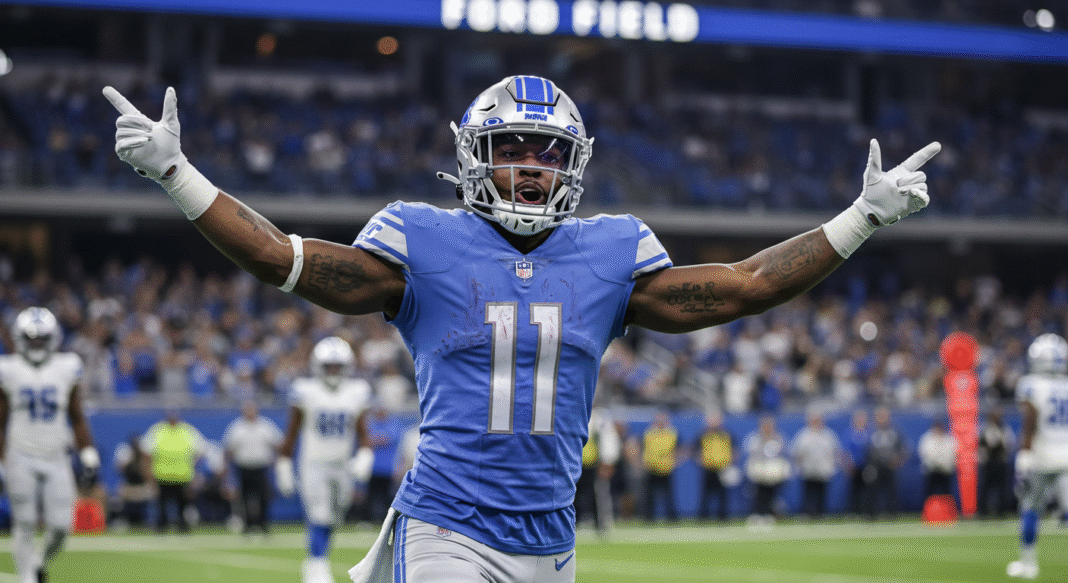
Ford Field erupted as 64,316 fans watched Tennessee control the ball for over 35 minutes, rack up 416 total yards, and lose by 38 points.
The Lions (6-1) posted their best seven-game record since 1956. Their 52 points marked their second-highest total ever, behind only a 55-point explosion against Chicago in 1997.
Tennessee arrived already signaling surrender. They’d traded DeAndre Hopkins and Ernest Jones Jr. earlier in the week. By game’s end, coach Brian Callahan was blunt: “You’re going to get blown out by every team in the league turning the ball over four times. We just don’t complement each other at all.”
Complete Team Statistics
| Statistic | Tennessee Titans | Detroit Lions |
|---|---|---|
| Final Score | 14 | 52 |
| Total Yards | 416 | 225 |
| First Downs | 23 | 17 |
| Passing Yards | 258 | 61 |
| Rushing Yards | 158 | 164 |
| Yards Per Play | 5.9 | 4.8 |
| Turnovers | 4 | 0 |
| Time of Possession | 35:37 | 24:23 |
| Penalties | 8-60 | 3-29 |
| Sacks Allowed | 4-33 | 1-8 |
| 3rd Down Efficiency | 3/11 (27%) | 3/9 (33%) |
| 4th Down Efficiency | 1/2 (50%) | 0/0 |
| Red Zone Efficiency | 2/4 (50%) | 5/5 (100%) |
Perfect red zone efficiency. Zero turnovers. Game over.
Individual Player Statistics
Passing Statistics
| Player | Team | Comp/Att | Yards | TDs | INTs | Rating | Sacked | Long |
|---|---|---|---|---|---|---|---|---|
| Mason Rudolph | TEN | 22/38 | 266 | 1 | 2 | 66.3 | 4-33 | 47 |
| Jared Goff | DET | 12/15 | 85 | 3 | 0 | 129.9 | 1-8 | 24 |
| David Montgomery | DET | 1/1 | 3 | 1 | 0 | 118.7 | 0-0 | 3 |
| Hendon Hooker | DET | 2/3 | 6 | 0 | 0 | 70.1 | 0-0 | 4 |
Early in the third quarter, Detroit had 42 points.
Goff had 28 passing yards.
“I don’t think I’ve ever been a part of something like that,” the 30-year-old quarterback admitted. Montgomery’s touchdown pass to LaPorta gave the Lions their highest-scoring first half since 1970.
Rushing Statistics
| Player | Team | Attempts | Yards | Average | TDs | Long |
|---|---|---|---|---|---|---|
| Jahmyr Gibbs | DET | 11 | 127 | 11.5 | 1 | 70 |
| Tony Pollard | TEN | 20 | 95 | 4.8 | 0 | 17 |
| David Montgomery | DET | 9 | 33 | 3.7 | 1 | 9 |
| Julius Chestnut | TEN | 7 | 32 | 4.6 | 0 | 9 |
| Mason Rudolph | TEN | 4 | 29 | 7.3 | 1 | 14 |
| Craig Reynolds | DET | 3 | 3 | 1.0 | 0 | 3 |
| Calvin Ridley | TEN | 1 | 3 | 3.0 | 0 | 3 |
| Jared Goff | DET | 1 | 1 | 1.0 | 0 | 1 |
Tennessee tied it 7-7. Detroit’s next play: Gibbs 70 yards. Touchdown. Tie broken permanently.
Pollard’s season-high 95 yards on 20 carries? Zero points.
Receiving Statistics
| Player | Team | Receptions | Targets | Yards | TDs | Long |
|---|---|---|---|---|---|---|
| Calvin Ridley | TEN | 10 | 15 | 143 | 0 | 47 |
| Sam LaPorta | DET | 6 | 6 | 48 | 1 | 24 |
| Nick Westbrook-Ikhine | TEN | 2 | 4 | 39 | 1 | 34 |
| Josh Whyle | TEN | 2 | 2 | 33 | 0 | 33 |
| Tony Pollard | TEN | 3 | 4 | 23 | 0 | 17 |
| Chig Okonkwo | TEN | 2 | 5 | 14 | 0 | 18 |
| Tyler Boyd | TEN | 3 | 6 | 14 | 0 | 5 |
| Kalif Raymond | DET | 2 | 2 | 14 | 1 | 7 |
| Brock Wright | DET | 1 | 1 | 8 | 1 | 8 |
| Amon-Ra St. Brown | DET | 2 | 2 | 7 | 1 | 6 |
| Jahmyr Gibbs | DET | 1 | 1 | 6 | 0 | 6 |
| Isaiah Williams | DET | 2 | 3 | 6 | 0 | 4 |
| David Montgomery | DET | 1 | 1 | 5 | 0 | 5 |
Ridley matched his career high with 10 catches. Posted a season-high 143 yards. Then fumbled.
All those yards vanished.
Detroit played without Jameson Williams, suspended for violating the NFL’s performance-enhancing substance policy. “We didn’t miss a beat,” Dan Campbell said.
Turning Points
Kalif Raymond’s Historic Revenge
Raymond finished with 190 punt return yards on five returns. Fifth-highest single-game total in NFL history. His 90-yard touchdown made it 42-14.
Against his former team.
First Lion ever to score both a punt return touchdown and receiving touchdown in the same game.
Special Teams Statistics
| Player | Team | Return Type | Returns | Yards | Average | TDs | Long |
|---|---|---|---|---|---|---|---|
| Kalif Raymond | DET | Punt Returns | 5 | 190 | 38.0 | 1 | 90 |
| Khalil Dorsey | DET | Kickoff Returns | 1 | 72 | 72.0 | 0 | 72 |
| Jha’Quan Jackson | TEN | Punt Returns | 3 | 24 | 8.0 | 0 | 11 |
| Jha’Quan Jackson | TEN | Kickoff Returns | 1 | 29 | 29.0 | 0 | 29 |
Detroit became the third team since 1941 to record both a 90+ yard punt return and a 70+ yard kickoff return in the same game.
Two hundred sixty-two return yards allowed by Tennessee.
Punting and Kicking
| Player | Team | Category | Stats |
|---|---|---|---|
| Jack Fox | DET | Punting | 5 punts, 305 yards, 61.0 avg, 3 inside 20, 67 long |
| Ryan Stonehouse | TEN | Punting | 6 punts, 296 yards, 49.3 avg, 2 inside 20, 62 long |
| Jake Bates | DET | Kicking | 1/1 FG (51 yards), 7/7 XP, 10 points |
| Nick Folk | TEN | Kicking | 0/0 FG, 2/2 XP, 2 points |
Fox averaged 61.0 yards per punt. Stonehouse managed 49.3. That difference gave Raymond his runway.
Four Turnovers That Buried Tennessee
First Quarter: Trevor Nowaske intercepted Rudolph after Levi Onwuzurike’s pressure. Detroit ball at Tennessee’s 23. Touchdown two plays later.
Second Quarter: Kerby Joseph read Rudolph’s eyes, picked him off. Detroit ball at Tennessee’s 12. Four plays later: 28-14.
Third Quarter: Calvin Ridley caught a pass. Amik Robertson punched the ball out. Carlton Davis III recovered. Another short field. Another touchdown.
Third Quarter: Chig Okonkwo caught one. Robertson forced another fumble. Isaiah Thomas recovered.
Robertson: Two forced fumbles. Both recovered by teammates.
“I’ve got to protect the ball better and put our defense in a better situation,” Rudolph said. “I thought we did good things in the first half and we did move the ball, possess the ball, but none of that matters when you get your butt kicked.”
Key Defensive Performers
| Player | Team | Total Tackles | Solo | Sacks | INTs | FF | FR | QB Hits |
|---|---|---|---|---|---|---|---|---|
| Jack Campbell | DET | 11 | 6 | 0 | 0 | 0 | 0 | 0 |
| Arden Key | TEN | 6 | 3 | 2 | 0 | 0 | 0 | 3 |
| Kerby Joseph | DET | 6 | 5 | 0 | 1 | 0 | 0 | 0 |
| Alex Anzalone | DET | 5 | 5 | 1 | 0 | 0 | 0 | 1 |
| Amik Robertson | DET | 2 | 2 | 0 | 0 | 2 | 0 | 0 |
| Trevor Nowaske | DET | 0 | 0 | 0 | 1 | 0 | 0 | 0 |
Tennessee generated four sacks. Key led with two. Jeffery Simmons and Roger McCreary each added one.
Didn’t matter.
Zero turnovers forced by Tennessee’s defense.
Complete Defensive Statistics
| Player | Team | Total | Solo | Ast | Sacks | INT | PD | FF | FR |
|---|---|---|---|---|---|---|---|---|---|
| Jack Campbell | DET | 11 | 6 | 5 | 0 | 0 | 0 | 0 | 0 |
| Jack Gibbens | TEN | 8 | 4 | 4 | 0 | 0 | 0 | 0 | 0 |
| Terrion Arnold | DET | 7 | 7 | 0 | 0 | 0 | 1 | 0 | 0 |
| Amani Hooker | TEN | 7 | 5 | 2 | 0 | 0 | 0 | 0 | 0 |
| Quandre Diggs | TEN | 7 | 5 | 2 | 0 | 0 | 0 | 0 | 0 |
| Brian Branch | DET | 6 | 6 | 0 | 0 | 0 | 0 | 0 | 0 |
| Jarvis Brownlee Jr. | TEN | 5 | 1 | 4 | 0 | 0 | 0 | 0 | 0 |
| Jeffery Simmons | TEN | 4 | 3 | 1 | 1 | 0 | 0 | 0 | 0 |
| Khalil Dorsey | DET | 4 | 1 | 3 | 0 | 0 | 0 | 0 | 0 |
| Sebastian Joseph-Day | TEN | 4 | 3 | 1 | 0 | 0 | 0 | 0 | 0 |
| T’Vondre Sweat | TEN | 4 | 1 | 3 | 0 | 0 | 0 | 0 | 0 |
| Roger McCreary | TEN | 3 | 3 | 0 | 1 | 0 | 0 | 0 | 0 |
| Jalen Reeves-Maybin | DET | 3 | 2 | 1 | 0 | 0 | 0 | 0 | 0 |
| James Houston | DET | 3 | 1 | 2 | 0 | 0 | 0 | 0 | 0 |
| Isaiah Thomas | DET | 3 | 0 | 3 | 0 | 0 | 0 | 0 | 1 |
| Carlton Davis III | DET | 2 | 2 | 0 | 0 | 0 | 1 | 0 | 1 |
| Levi Onwuzurike | DET | 2 | 2 | 0 | 0 | 0 | 0 | 0 | 0 |
| Harold Landry III | TEN | 2 | 0 | 2 | 0 | 0 | 0 | 0 | 0 |
| Luke Gifford | TEN | 2 | 1 | 1 | 0 | 0 | 0 | 0 | 0 |
| Josh Whyle | TEN | 2 | 1 | 1 | 0 | 0 | 0 | 0 | 0 |
The 1-Yard Line Catastrophe
Tennessee had first and goal from Detroit’s 1-yard line. Down 35-14. Under a minute left in the half.
Four plays:
First down: Rudolph to Westbrook-Ikhine. Incomplete.
Second down: Target Whyle. Incomplete.
Third down: Target Okonkwo. Incomplete.
Fourth down: Target Ridley. Incomplete.
Turnover on downs.
From the 1-yard line.
How Detroit Scored 52 on 225 Yards
| Quarter | Time | Team | Play | Drive | Starting Position | Score |
|---|---|---|---|---|---|---|
| 1 | 10:31 | DET | Montgomery 7-yd run | 2 plays, 23 yards | TEN 23 | 0-7 |
| 1 | 4:07 | TEN | Rudolph 11-yd run | 4 plays, 75 yards | TEN 25 | 7-7 |
| 2 | 13:57 | DET | Gibbs 70-yd run | 1 play, 70 yards | DET 30 | 7-14 |
| 2 | 14:18 | TEN | Westbrook-Ikhine 5-yd pass | 7 plays, 70 yards | TEN 30 | 14-14 |
| 2 | 12:51 | DET | Wright 8-yd pass | 3 plays, 25 yards | TEN 25 | 14-21 |
| 2 | 11:37 | DET | St. Brown 1-yd pass | 4 plays, 12 yards | TEN 12 | 14-28 |
| 2 | 2:18 | DET | LaPorta 3-yd pass from Montgomery | 7 plays, 22 yards | TEN 22 | 14-35 |
| 3 | 12:46 | DET | Raymond 90-yd punt return | N/A | N/A | 14-42 |
| 3 | 6:12 | DET | Raymond 7-yd pass | 3 plays, 26 yards | TEN 26 | 14-49 |
| 3 | 1:08 | DET | Bates 51-yd FG | 4 plays, 11 yards | TEN 44 | 14-52 |
Six Detroit scoring drives started in Tennessee territory.
Average starting position: Tennessee’s 27-yard line.
Injury Report
Tennessee Titans:
- Will Levis (shoulder) – Missed second straight game
- L’Jarius Sneed (quadriceps) – Inactive
Detroit Lions:
- Jameson Williams – Suspended (PED violation)
- Malcom Rodriguez (ankle) – Ruled out first half
- Josh Paschal (illness) – Inactive
Dan Campbell said Rodriguez’s injury didn’t appear season-ending.
Coaching Reactions
“We play with three units and when a couple of them are humming at the right time, it can bail out one of your units,” Campbell explained.
Callahan’s assessment was brutal: “Right now, our special teams gives up yards, our defense doesn’t get a stop and we don’t do anything on offense and we turn it over. Everything needs to be better.”
The Long Shadow
Today, more than ten months after this debacle, both franchises have traveled different paths. Detroit’s complementary football formula carried them deep into January. Tennessee’s coaching staff faced immediate questions about accountability and execution.
Fantasy analysts at TheSportie.com reference this game when explaining efficiency versus volume metrics. Gibbs: 11.5 yards per carry, touchdown, fantasy gold. Pollard: 4.8 yards per carry, 20 attempts, zero touchdowns, fantasy disappointment. Ridley: 10 catches, 143 yards, one fumble that negated everything.
Mason Rudolph stood at midfield after the final whistle, watching Detroit celebrate. Four turnovers. Four straight incompletions from the 1-yard line. 416 yards. 14 points.
The scoreboard never lies.
The Tennessee Titans vs Detroit Lions player stats from October 27, 2024, captured everything wrong with valuing yardage over execution. Tennessee moved the ball. Detroit scored points. One team executed when it mattered. The other collected meaningless statistics between catastrophic failures.


